Introduction
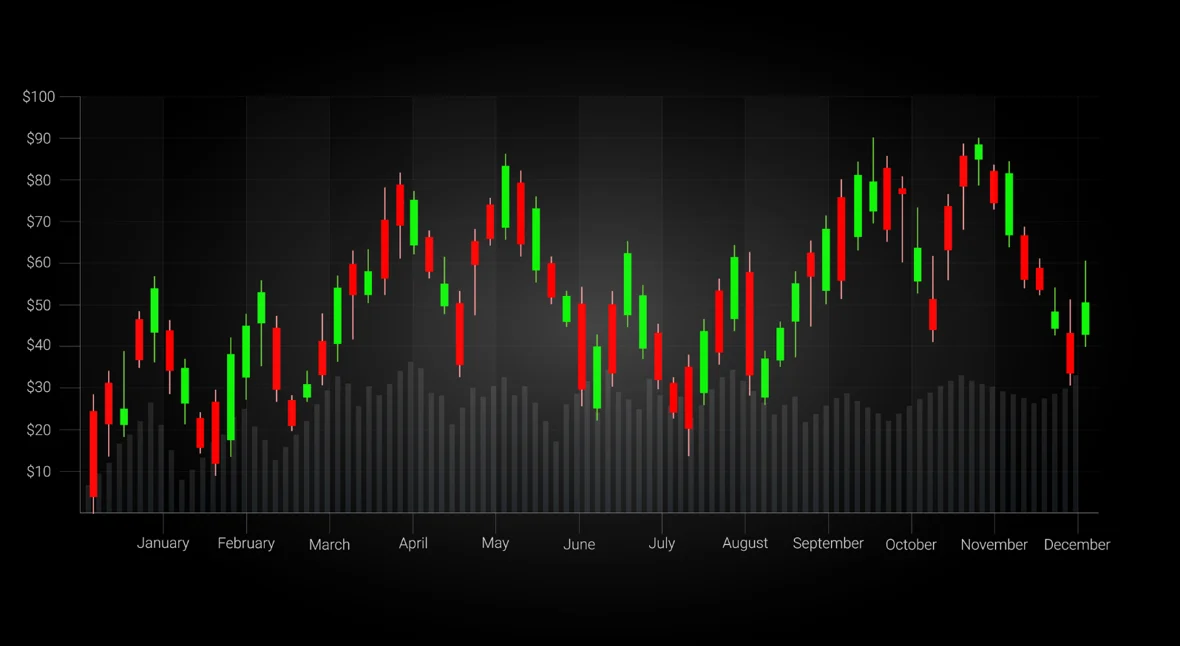
The first time I opened a trading app and saw a screen full of red and green sticks, I genuinely had no clue what I was looking at. If you’re in that same spot, learning candlestick chart patterns is probably the single most useful skill you can pick up before placing your first trade. It’s not magic, and it won’t predict the future perfectly, but it does tell you a story about buyer and seller behavior.
The Basic Anatomy of a Candlestick
Quick Answer: Each candlestick shows four prices for a time period — open, high, low, and close — with the body representing the open-close range and the thin lines (wicks) showing the high and low extremes reached.
A green (or sometimes white) candle means the closing price was higher than the opening price. A red (or black) candle means the opposite — price closed lower than it opened.
Understanding Candle Body and Wicks
- Long body = strong momentum in one direction, buyers or sellers clearly in control
- Short body = indecision, buyers and sellers roughly balanced
- Long upper wick = price rose sharply but sellers pushed it back down
- Long lower wick = price dropped sharply but buyers stepped in and pushed it back up
Has this ever happened to you — you see a huge green candle and jump in, only for the price to reverse right after? That’s often because you’re reacting to the candle without checking the wick, which sometimes tells a different story than the body alone.
Common Bullish Candlestick Patterns
- Hammer — small body near the top, long lower wick, usually signals a potential bottom
- Bullish Engulfing — a small red candle followed by a larger green candle that “engulfs” it completely
- Morning Star — a three-candle pattern signaling a potential trend reversal upward
Common Bearish Candlestick Patterns
- Shooting Star — small body near the bottom, long upper wick, hints at a potential top
- Bearish Engulfing — a small green candle followed by a bigger red candle swallowing it
- Evening Star — the mirror image of the morning star, hinting at a downward reversal
Why Context Matters More Than the Pattern Itself
Here’s my honest opinion, and some traders will disagree — a single candlestick pattern in isolation is almost meaningless. What matters is where it appears. A hammer pattern near a strong support level carries far more weight than the same hammer appearing randomly in the middle of a range. I’ve seen beginners get burned trading patterns without checking the broader trend first.
Combining Candlesticks With Volume
A green engulfing candle on unusually high volume tells a stronger story than the same pattern on a quiet, low-volume day. Volume essentially confirms whether the price move has real conviction behind it, or if it’s just noise. [link to related guide on IPO investing basics here]
FAQs
Do candlestick patterns work on all timeframes? They work across timeframes, but patterns on daily or weekly charts are generally considered more reliable than 1-minute or 5-minute charts.
Can candlestick patterns alone guarantee profitable trades? No — they’re a tool for probability, not certainty, and should be combined with other indicators like support/resistance or volume.
What’s the difference between a doji and a spinning top? A doji has an almost non-existent body, showing extreme indecision, while a spinning top has a slightly larger body but still shows indecision.
Should beginners start with candlestick trading immediately? It helps to first understand basic price charts and trends before layering candlestick pattern reading on top.
Are Japanese candlestick patterns relevant to Indian stock markets today? Yes, these patterns are universal across global markets, including NSE and BSE-listed stocks.
Conclusion
Reading candlestick chart patterns isn’t about memorizing every single formation — it’s about understanding the psychology behind price movement. Start with just 4-5 common patterns, practice spotting them on historical charts, and resist the urge to trade every pattern you see. Over time, you’ll notice which ones actually work well for the stocks or sectors you follow most closely.
Suggested Alt Text: “Candlestick chart showing bullish and bearish patterns on stock trading screen”